Fuzzy Bars: Predictive Election Visualization
Rebuilding one of The Washington Post's most visible and dynamic election features
My Role
- Position: Senior Software Engineer
- Responsibilities: Front-End Architecture, Data Integration, Live Testing
- Collaborators: Data Scientists, Editors, Engineering Team
Summary
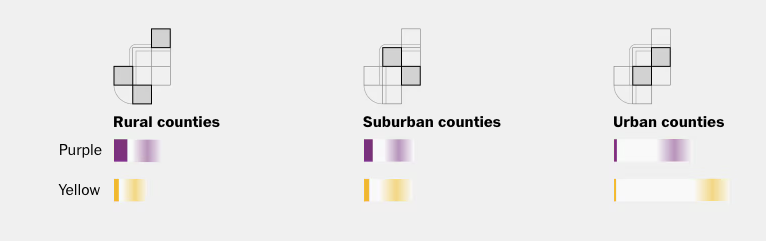
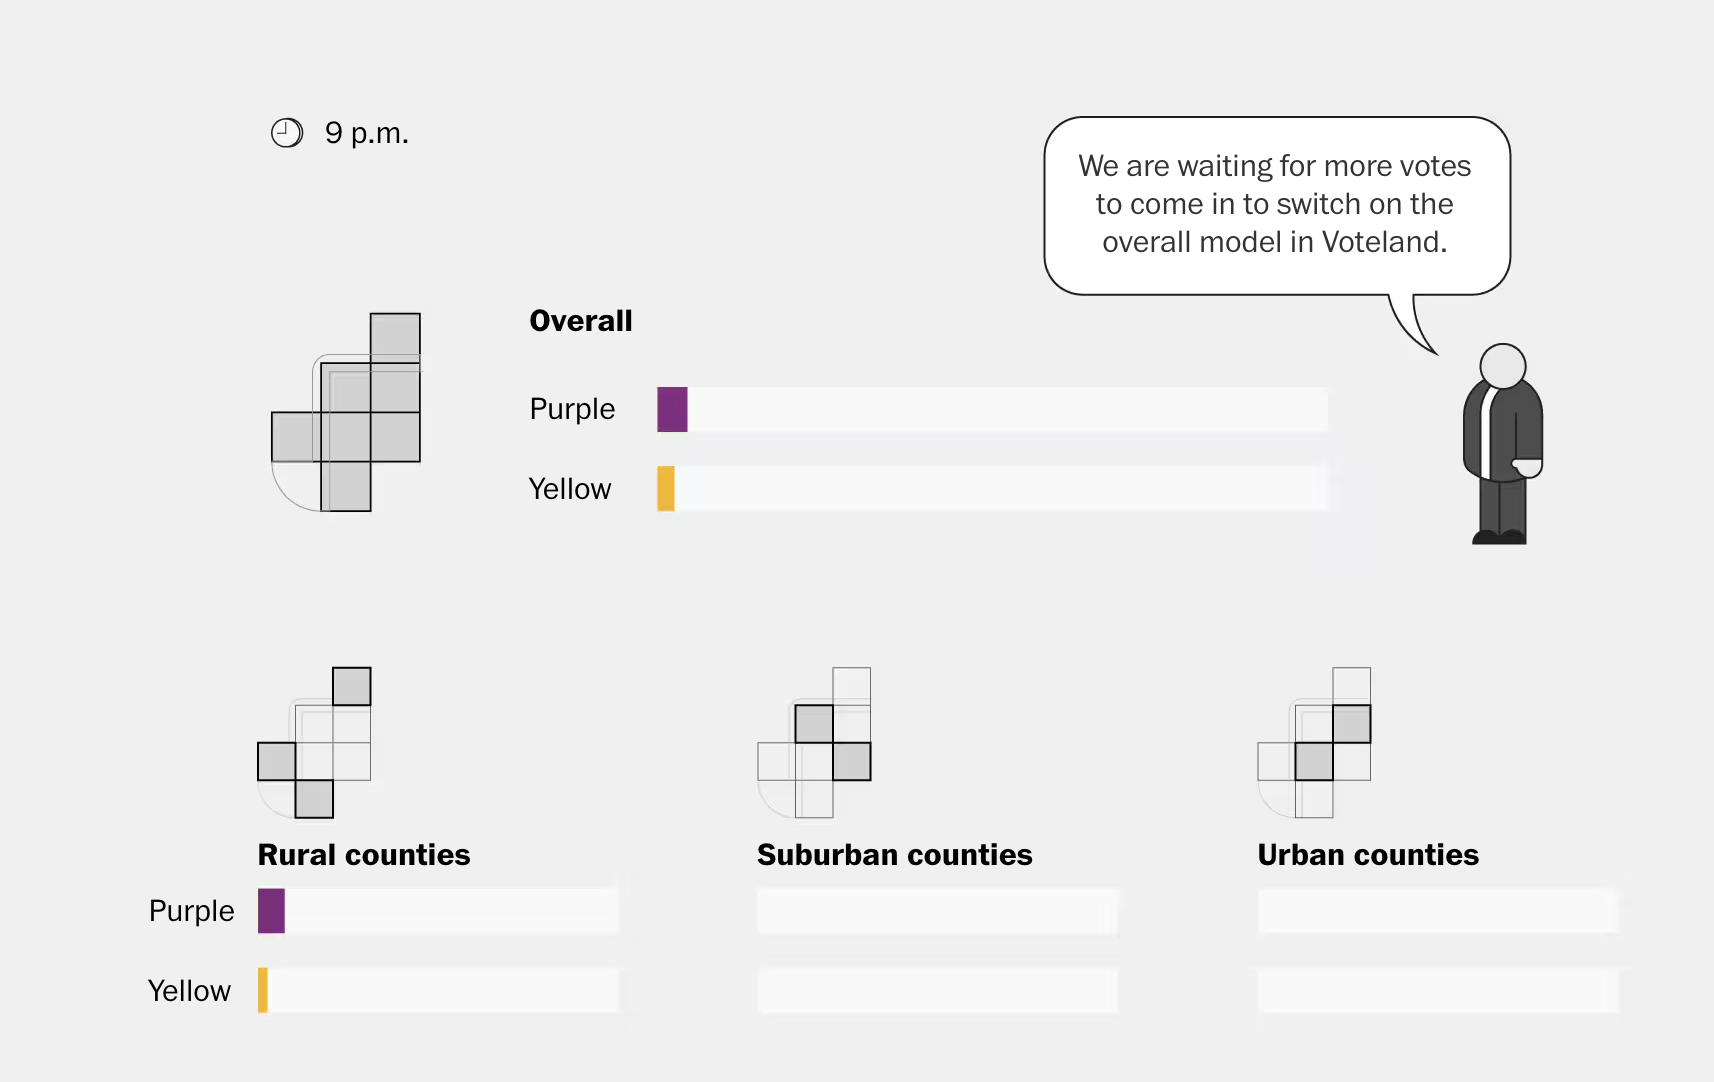
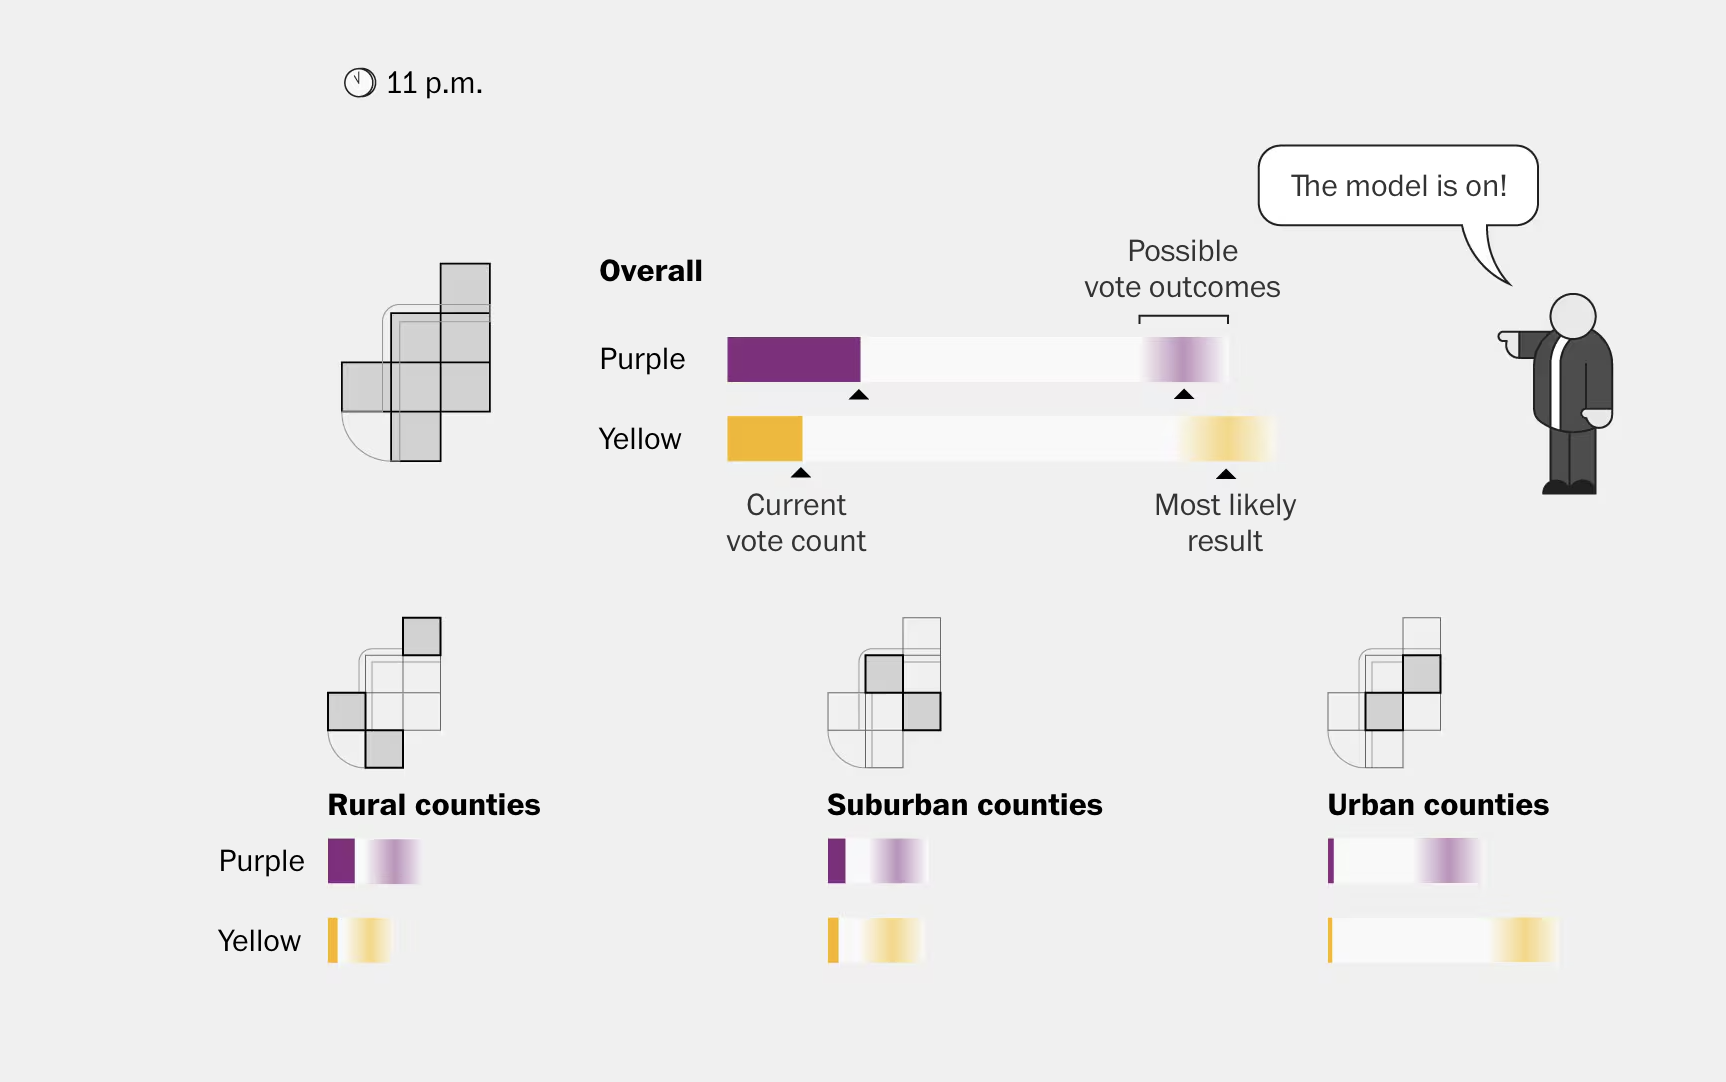
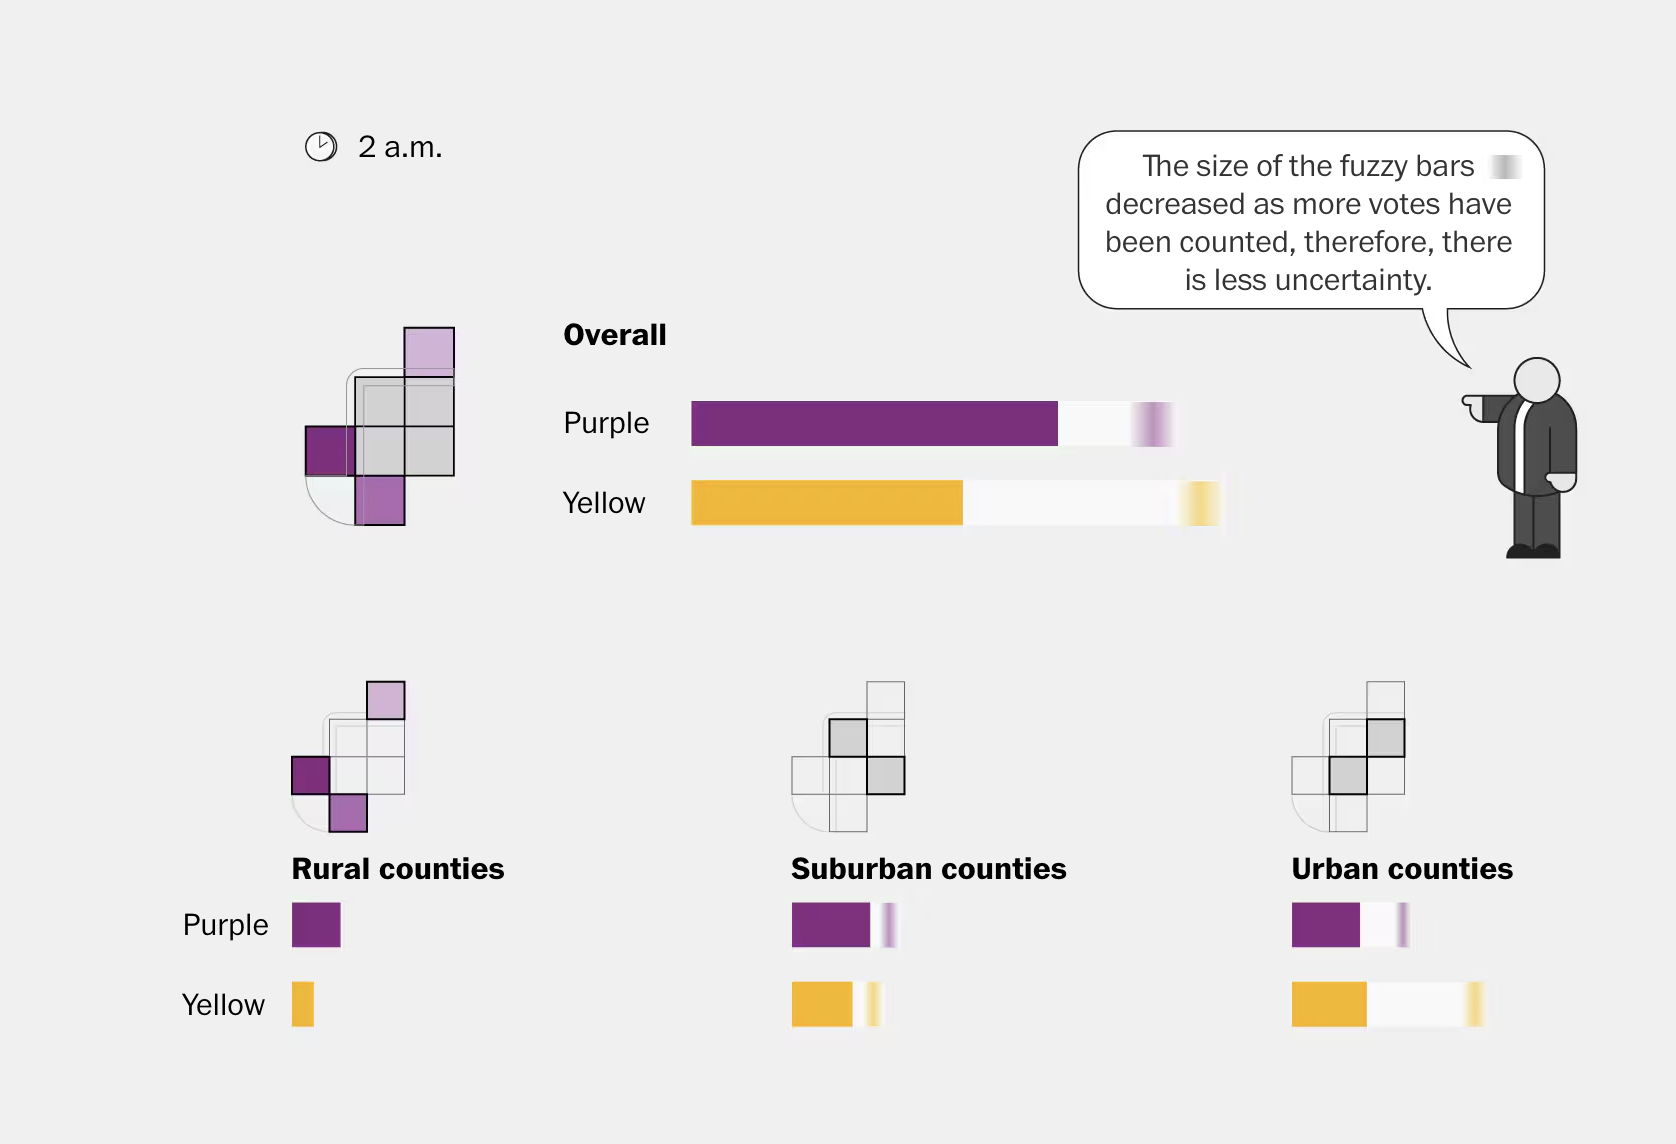
I rebuilt the Fuzzy Bars visualization, The Post’s predictive model for projecting race outcomes. It’s a high-stakes, highly dynamic feature viewed by millions on election night. My role involved leading the frontend rebuild to ensure durability, accuracy, and clarity under pressure.
Problem
The original implementation, while popular, was fragile and prone to bugs under the dynamic conditions of election night. Labels often misaligned, layout logic broke under edge cases, and visual fidelity suffered when the data shifted rapidly. The UI needed to reflect real-time predictions from a complex backend model, while remaining readable, accurate, and beautiful.
Goals
- Improve reliability and visual consistency across dynamic data changes
- Ensure UI accuracy matches backend predictive models
- Make the design readable and intuitive under election night stress
- Support real-time coordination between frontend and data science teams
- Ensure implementation is responsive and readable on all device types
Process
I rebuilt the frontend using TypeScript, React, and D3. I worked closely with data scientists to align on prediction logic and updated data shapes. I created dynamic positioning logic for labels and elements that adapted gracefully to changing inputs. I also tested dozens of edge cases and coordinated nightly with the data team to toggle the feature for key races in real-time.
Design Decisions
- Used D3 for flexible and precise control of label placement and animation
- Created dynamic spacing logic to avoid overlaps during live updates
- Developed a toggle system to show/hide Fuzzy Bars for key races
- Built guardrails for edge cases with missing or extreme data values
Challenges
The core challenge was the feature's unpredictability. We couldn’t anticipate all data permutations until live results flowed in. I built the system to be resilient and readable no matter what came in. On election night, I worked side-by-side with data scientists to QA results and deploy toggles for races with notable predictive trends.
Impact
- Improved frontend reliability during one of the site’s most trafficked events
- Aligned frontend visuals more closely with predictive backend models
- Received praise from leadership and journalists for clarity and trustworthiness
- Deepened collaboration between engineering and data science
Reflection
This project pushed me to build resilient software under real-time pressure and solidified my skills in collaborating with data teams. I learned how to build for uncertainty and how to maintain precision and polish even when data is constantly shifting beneath your feet.
Project information
- Category Data Visualization, Web Development
- Client The Washington Post
- Tools TypeScript, React, D3
- Project date June-July, 2022